

URGENT: Gathering Clouds
Can Clouds Tell Us When the Bull Run is Over

I first wrote this post in May. But I decided against publishing for several reasons.

Chief reason being the notion that I’ve not seen anybody analyse Bitcoin Bull runs in this way, so I don’t know that I have any way to corroborate this. The next being that I hope I am wrong. I really do (Bear Markets are not pretty at all). And another being that, I don’t know that I want to be alarmist, or be remembered as the Michael Burry of the 2021 Bull Run.
With that said, any one who follows me on Twitter and is observant, has likely seen me hint at this, in several ways.

Anyway, enough of the pre-amble. Enjoy.
Chairman ☝🏾™️
***
So this engagement will be more of an exposition than it will be an argument for or against. I am simply sharing with you, what I saw looking at the charts a few days ago.
Usually, Ichimoku cloud charts look like this:
However, for this conversation, we will filter out all of that, down to one line, like this:

Clean.
This line is called the lagging span. Now I won’t go into technical details of how the lines and clouds used for Ichimoku analysis are drawn (this is better left to more technically sound analysts than me). But here are a few things that matter. The Chikou span is calculated using x, y and z. And in the overall framework of Ichimoku powered trading, the lagging span is used as a barometer for how favorable the signals generated by the framework are. Ie. If it is above price, then Long signals are favored, and vice versa. This is all you need, for this particular conversation.
Going by the topic, the periods of interest to us, are the Bitcoin Bull runs. There are no controversies as to the following years fitting that criteria: 2013, 2017 and now, 2021. Even though 2011 fits the technical definitions of a Bull Run, we exclude it because it doesn’t fit into the general Halving narrative.
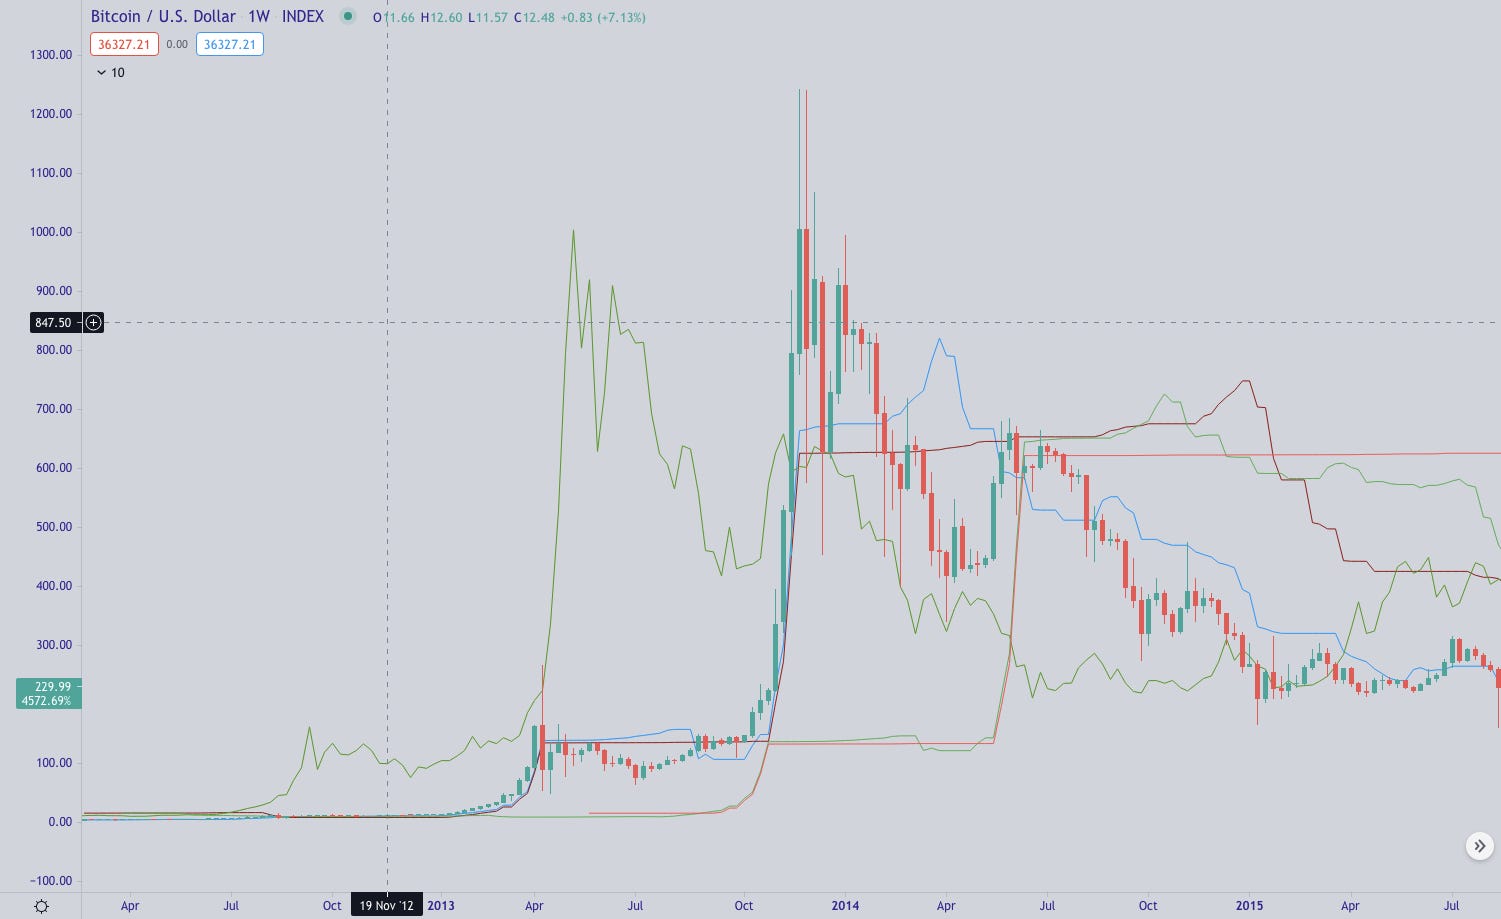
Thus we start in 2013:
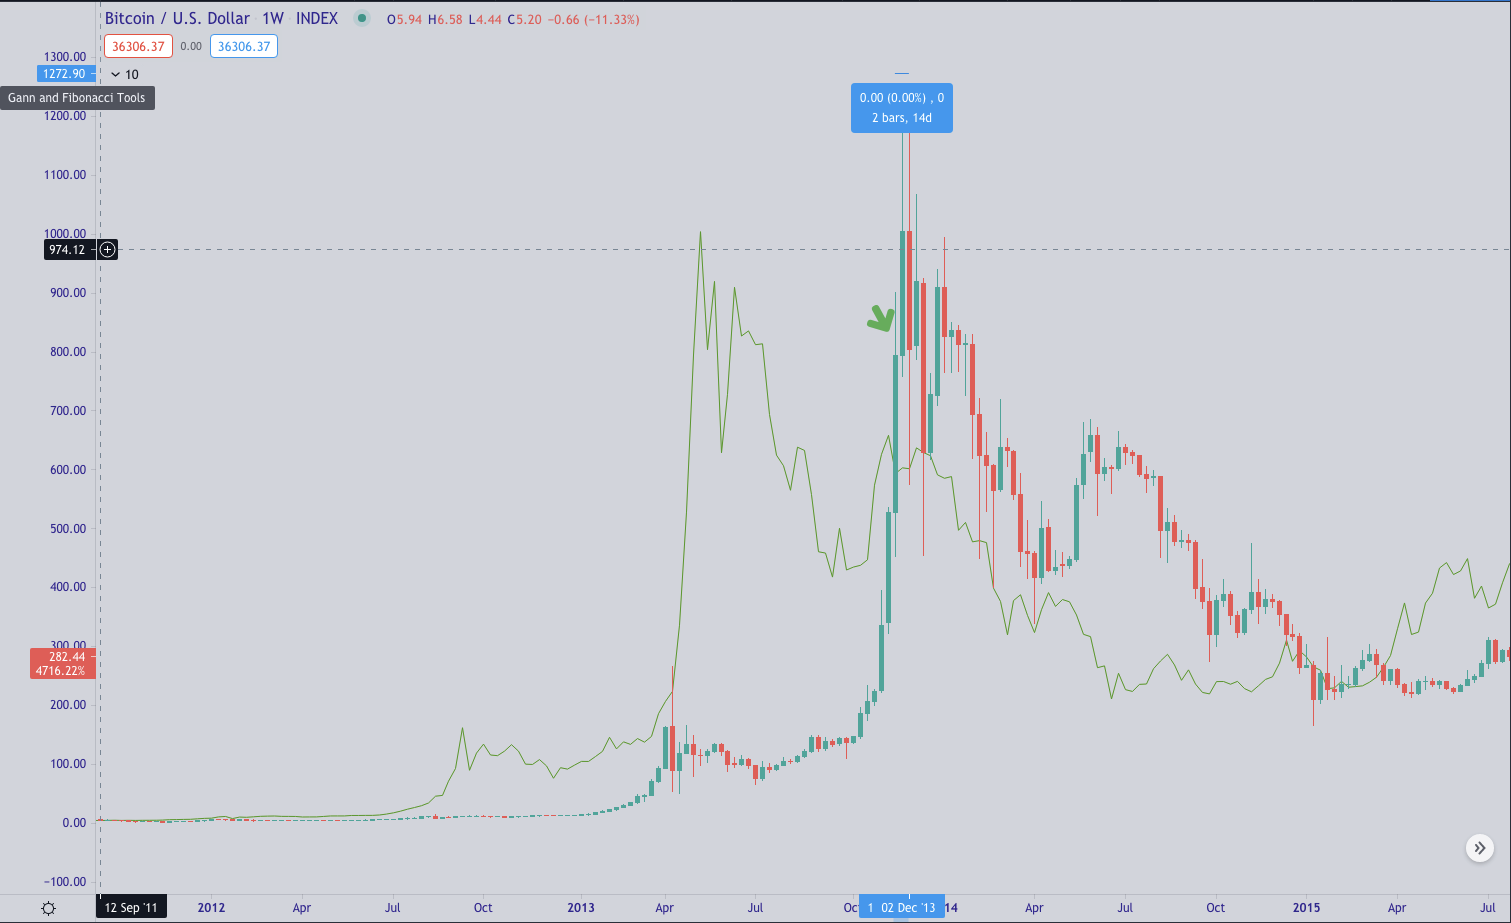
Then 2017
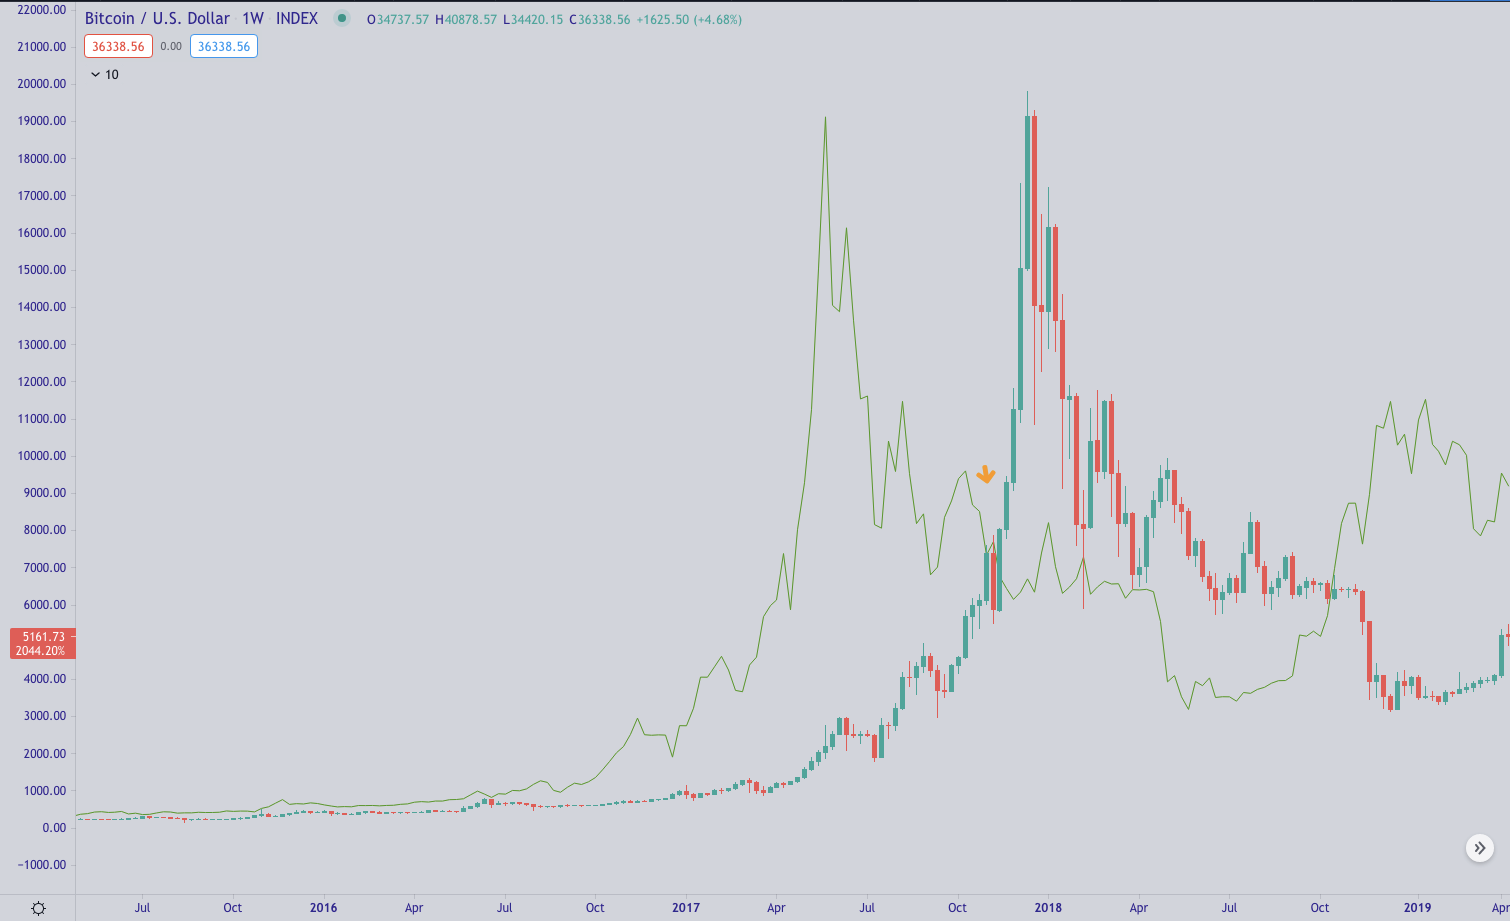
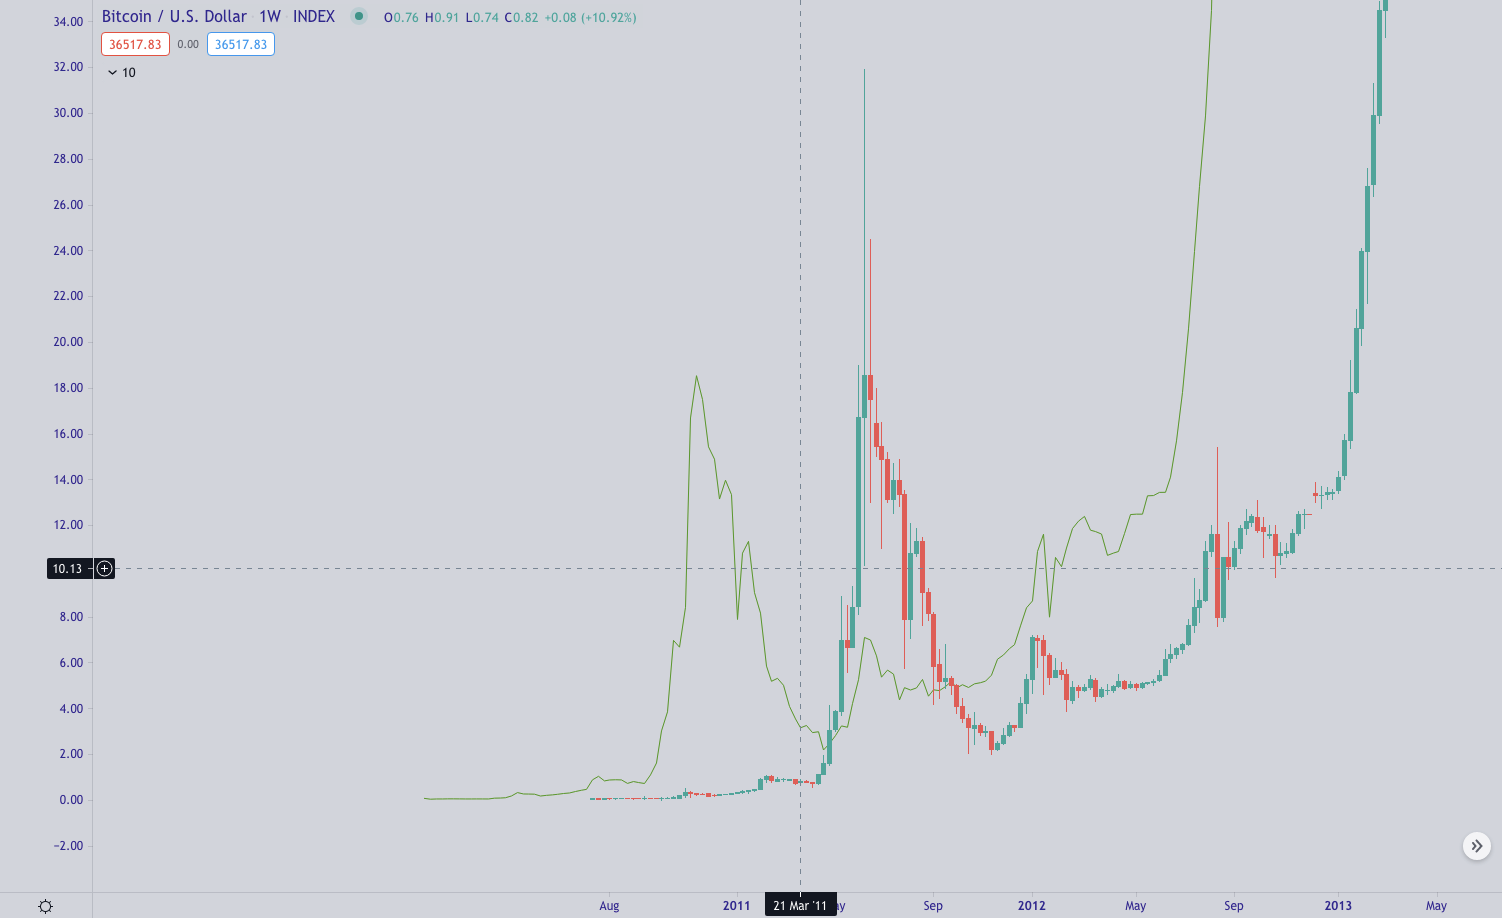
Since two points may or may not make a line, a stronger argument is made, when we have three points. So we will be constrained to bring 2011 into this conversation.
2011:
So let’s bring it to today: 2021
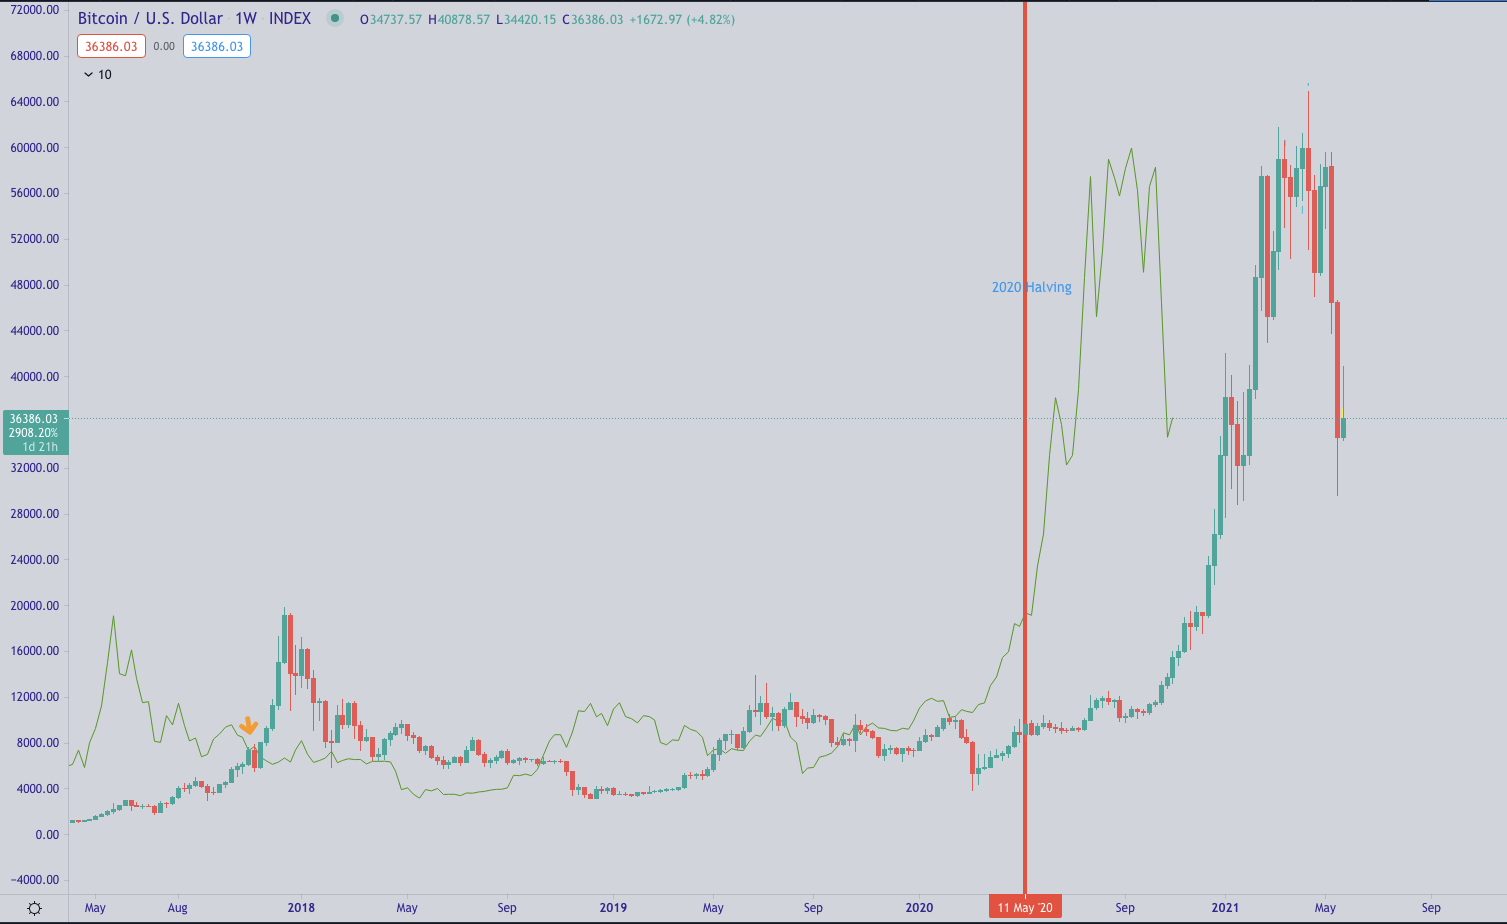
Clearly, there is good news here.
This being that, going by our very narrow use of the Ichimoku cloud here, the bull run is not over.
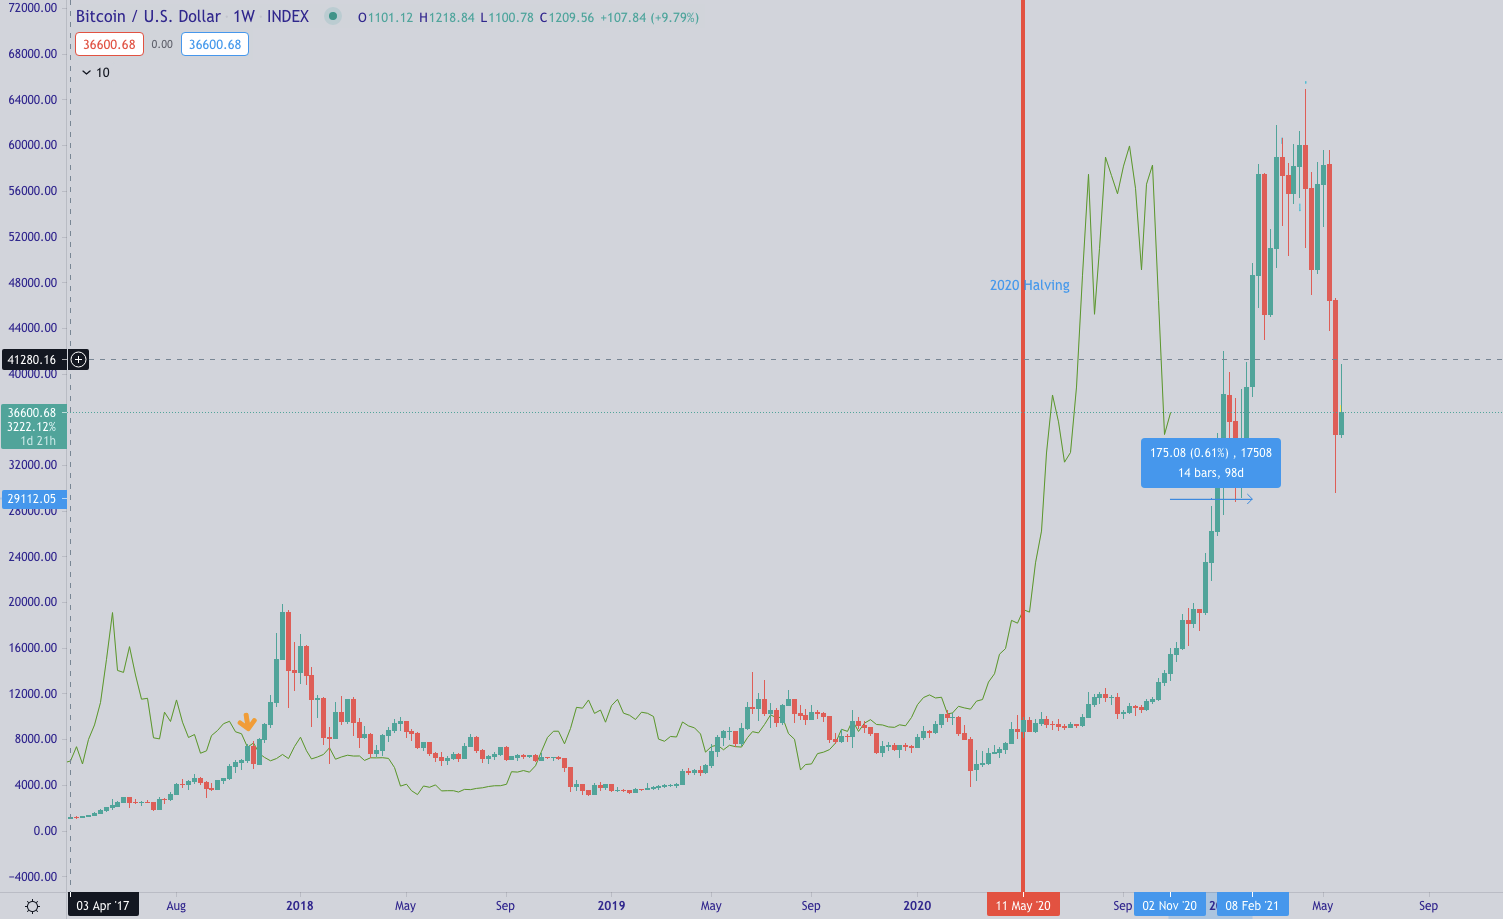
However, the bad news is that given this same use of the Ichimoku cloud, we’re anywhere between 9 and 13 weeks (remember, this was written in May) from the lagging span coming in contact with, and going under the price — thus marking, by our framework here, the end of the Bull Run 2021.
Sorry, supercycle fans.
***
This was in May.
Fast forward to now (September 2021):
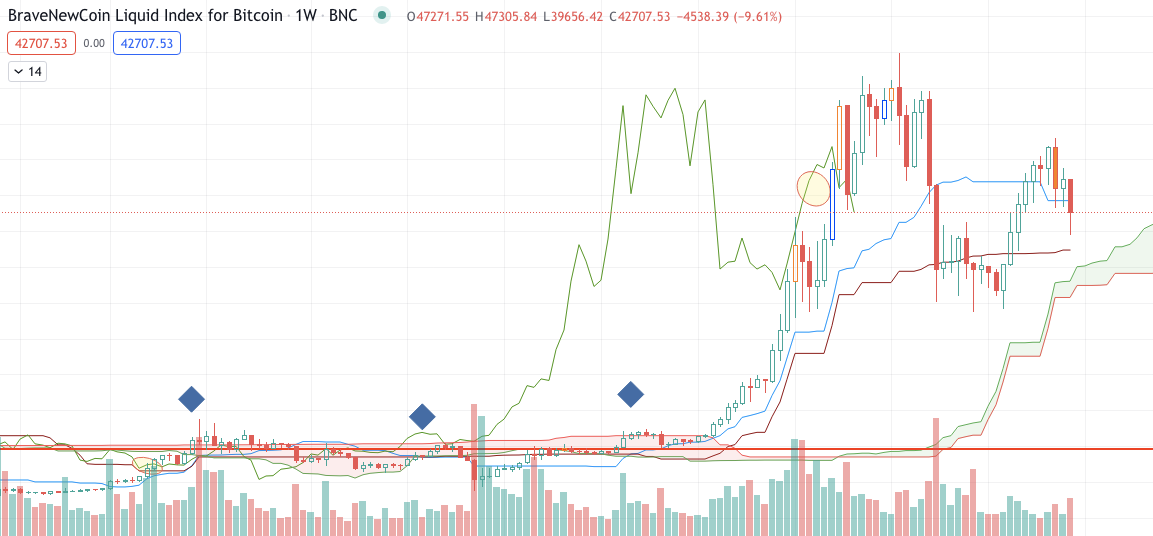
Lol. It would be nice to dramatically end this newsletter here. But that would be cruel.
What does this mean? If the Bull Run continues from here (and I would be happy that this is the case). Then this will be the first time that momentum is lost — the lagging span crosses under the price on the weekly — but that the Bitcoin bull run continues regardless.
There are several other reasons to believe that this might be this “first time” may be happening. But I don’t know that I am here to serve Hopium. Maybe in the next newsletter, I’ll do that.
I'm here to learn at the feet of the Prophet